library(naniar)
library(readr)
library(dplyr)
library(mice)
library(here)
library(tidyverse)11 Mechanisms of missingness
This book contains both practical guides on exploring missing data, as well as some of the deeper details of how naniar works to help you better explore your missing data. A large component of this book are the exercises that accompany each section in each chapter.
Once we have explored and cleaned up our messy missing data so that they are consistently stored as NA throughout, we need to dig further into missingness to responsibly decide on next steps. However, before further analysis, we need to ask and answer questions, such as:
- How should we deal with missing values (e.g. should we delete cases, or impute values)?
- How might that decision impact our analyses and outcomes?
To answer these questions, we need to understand and explore mechanisms of missingness.
Mechanisms of missingness answer the question “Why are values missing?”. For example, it could be that as your income increases, you might be less likely to report how much you paid in tax on a survey. So increased income leads to increasing missingness. Answering this question with certainty is really hard, and sometimes, impossible. We need to investigate missing data dependence, however, to inform decisions about dealing with missing values.
In this chapter, we introduce three mechanisms of missingness:
- MCAR - Missing Completely at Random
- MAR - Missing At Random
- MNAR - Missing Not At Random
Then, we explore and compare how those mechanisms of missingness might appear in missing data exploration using naniar functions for data visualization introduced in previous sections.
11.1 Missing completely at random (MCAR)
Missing completely at random, or MCAR, is missingness that has no association with any data you have observed, or not observed. In other words, the cause of the missingness can be considered truly random, and unrelated to observed or unobserved variables meaningful to the data and your analyses.
For example, imagine you are a tornado researcher. You are determined to deploy small devices into a tornado that, when suspended in the tornado, will record windspeeds and dynamics (yes - this is the plot of the classic film Twister starring Bill Paxton). One day while driving to try to launch your devices, your car runs out of gas, and you are unable to obtain windspeed readings. Those unrecorded windspeeds show up as NA in the dataset for that tornado. In this case, the cause of the missingness (running out of gas) is unrelated to tornado windspeeds - it can be considered a truly “random” cause of missingness, or missing completely at random (MCAR).
An important distinction: MCAR does not mean there is “no reason” for missingness. In this example, windspeed is missing for this tornado because you ran out of gas. It is still MCAR because the cause of missingness is unrelated to tornado windspeed in a meaningful way.
Critical thinking: Imagining that you are the tornado researcher in the example above, what other hypothetical causes may result in tornado windspeeds being missing completely at random (MCAR)?
11.1.1 How might MCAR appear in data?
A hypothetical example of how we might want MCAR to appear for the max_windspeed variable is shown below:
| date | severity | ave_temp_c | daily_precip_mm | max_windspeed_mph | notes |
|---|---|---|---|---|---|
| 7/22/20 | ef2 | 84 | 94 | 124 | NA |
| 8/9/20 | ef3 | 79 | 52 | 130 | NA |
| 6/15/20 | ef1 | 73 | 71 | 109 | NA |
| 9/18/20 | ef1 | 86 | 43 | 94 | NA |
| 10/5/19 | ef0 | 71 | 18 | 75 | NA |
| 10/15/19 | ef1 | 90 | 57 | NA | Ran out of gas; could not deploy |
| 9/8/19 | ef0 | 82 | 22 | 81 | NA |
| 8/17/18 | ef4 | 80 | 102 | 196 | NA |
| 8/26/18 | ef1 | 73 | 53 | NA | Team unavailable; could not deploy |
| 9/2/17 | ef2 | 78 | 39 | 114 | NA |
| 9/15/16 | ef5 | 85 | 164 | 208 | NA |
In the dataset above, we see two missing values (NA) in the max_windspeed column. For each, the comments in the notes column describe reasons for missingness that are unrelated to tornado windspeeds, and can thus be considered MCAR.
Aside on note keeping
The only reason we would definitively know missingness in windspeed is MCAR is due to the
notesvariable included. Keep this in mind when collecting your own data: taking contemporaneous notes about data collection, obstacles, etc. can be very useful when trying to determine why values are missing.
More often, we do not have notes explaining each missing value. If that is the case, how might we expect MCAR to appear in a larger dataset? Here, we again use a theoretical dataset, twister, for tornadoes to obviate how missing mechanisms might appear.
Warning: `gather_()` was deprecated in tidyr 1.2.0.
Please use `gather()` instead.
This warning is displayed once every 8 hours.
Call `lifecycle::last_lifecycle_warnings()` to see where this warning was generated.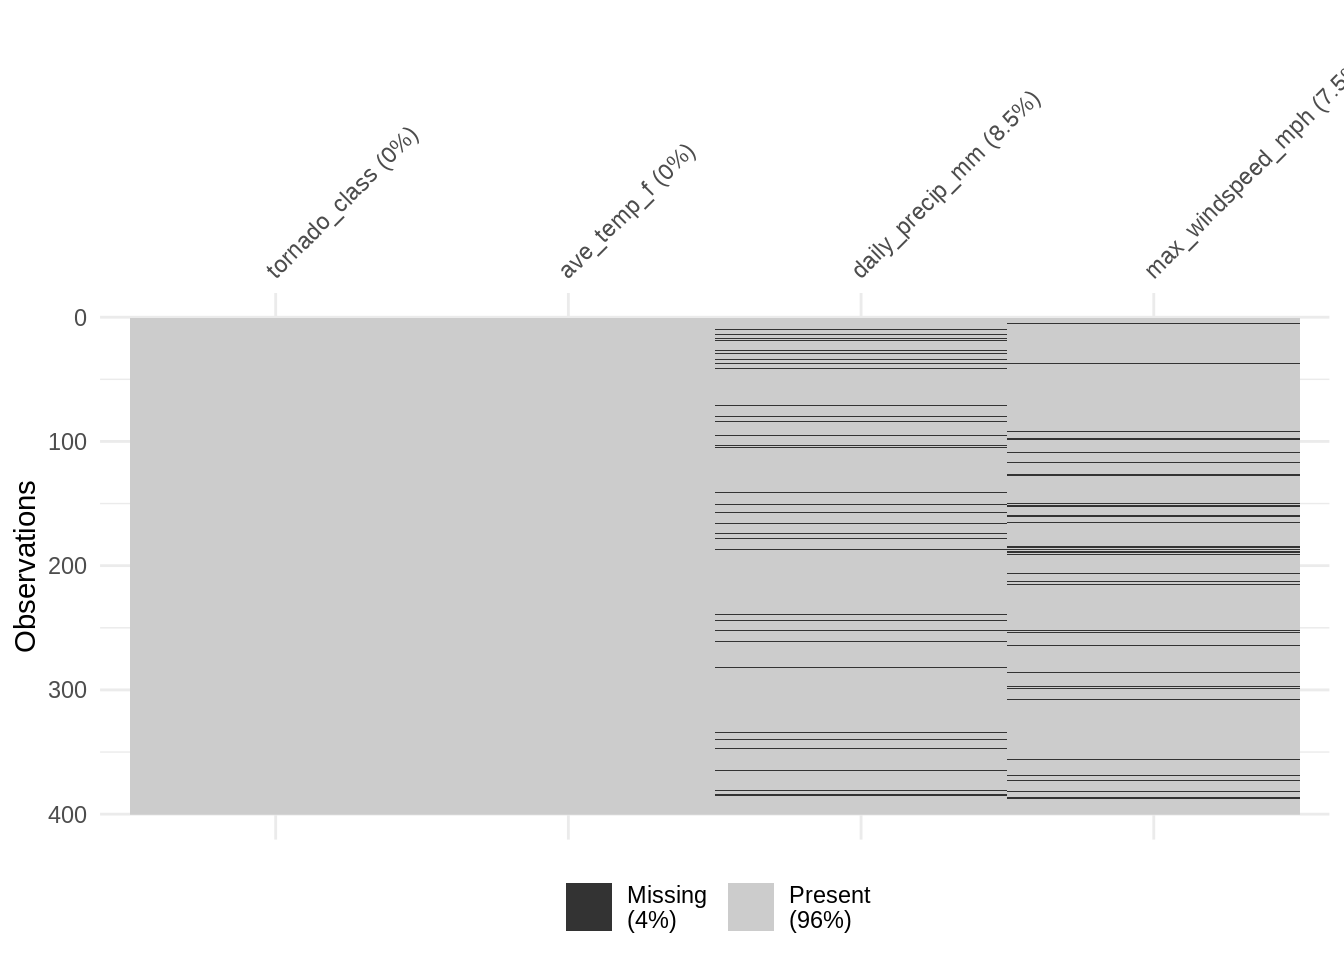
11.1.1.1 MCAR Implications
We can deal with missing values in a number of ways, but here we focus on two broad approaches: delete observations (rows) containing missing values for variables included in analyses, or impute (manufacture) data to “fill in” the missing values with reasonable values.
If missing values are MCAR, deleting observations containing missing values will not bias results, but reduces sample size (sometimes substantially). We call deleting entire rows, listwise deletion, if you decide to use listwise deletion, make sure to check how many observations are included in your analysis. Ideally do not delete unless there is less than 5% data loss. But really, you should be imputing your data always.
11.2 Missing at random (MAR)
Missing at random (MAR) occurs when missingness depends on data you have observed, but not on unobserved data.
Returning to our Twister tornado example: Imagine that you are again driving to release your wind speed devices into a tornado. Due to heavy rainfall, however (for which you do have data), several river crossings are flooded and you are unable to safely approach the tornado. Therefore, missingness in wind speed is due to another recorded variable in the data (rainfall, recorded as daily_precip_mm).
In this case, wind speed is Missing at Random because it is dependent on another recorded variable.
An Aside: Naming missingness
If you are thinking “Missing At Random (MAR) seems like a bad name - it is not random at all! The missingness is impacted by another recorded variable!” you are in abundant company. A number of people have called for this mechanism to be renamed as “Missing conditionally at random” instead, but so far the change has not gained widespread traction. At another meeting, “Missing For … Reasons” was also proposed, but was not specific enough. (Joking).
Critical thinking: Imagine you are the tornado researcher in the example above, what other hypothetical causes may result in tornado wind speeds being missing at random?
Let’s explore a different (also theoretical) dataset with twister recordings that might indicate values that are missing at random.
vis_miss(df_mar)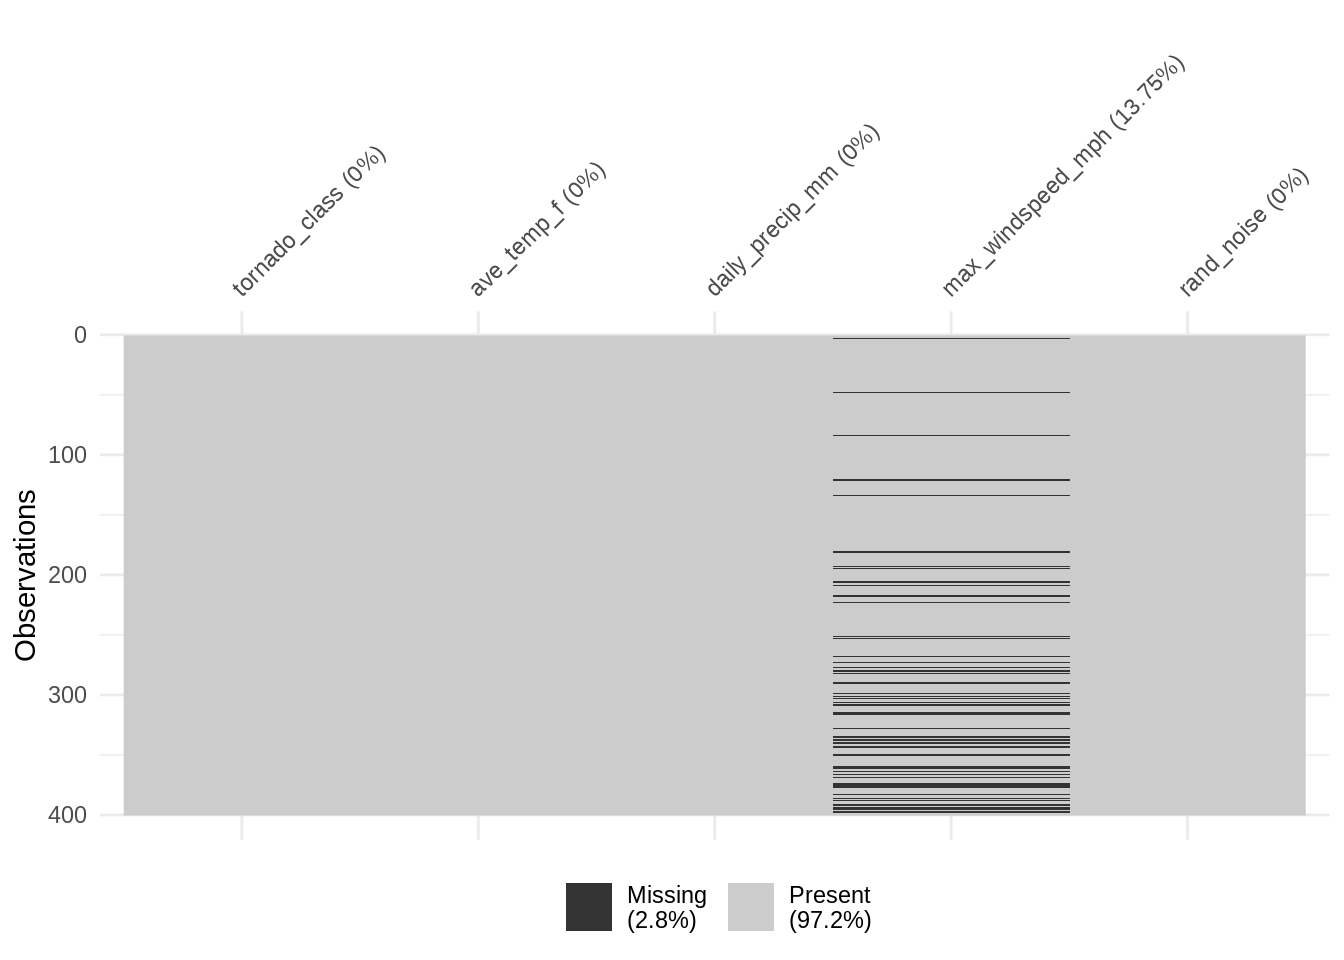
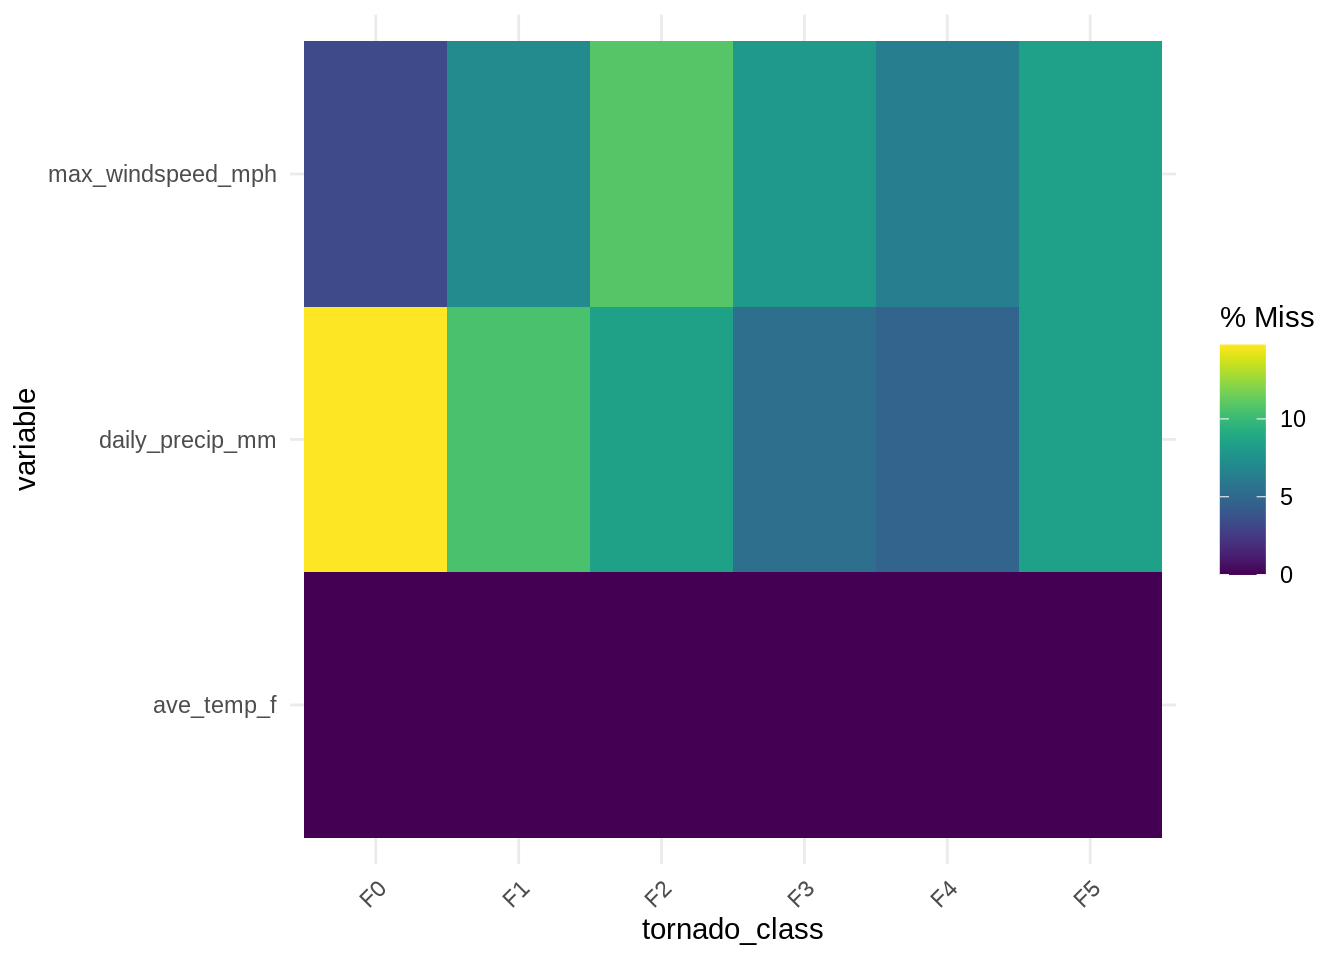
gg_miss_fct(df_mar, fct = tornado_class)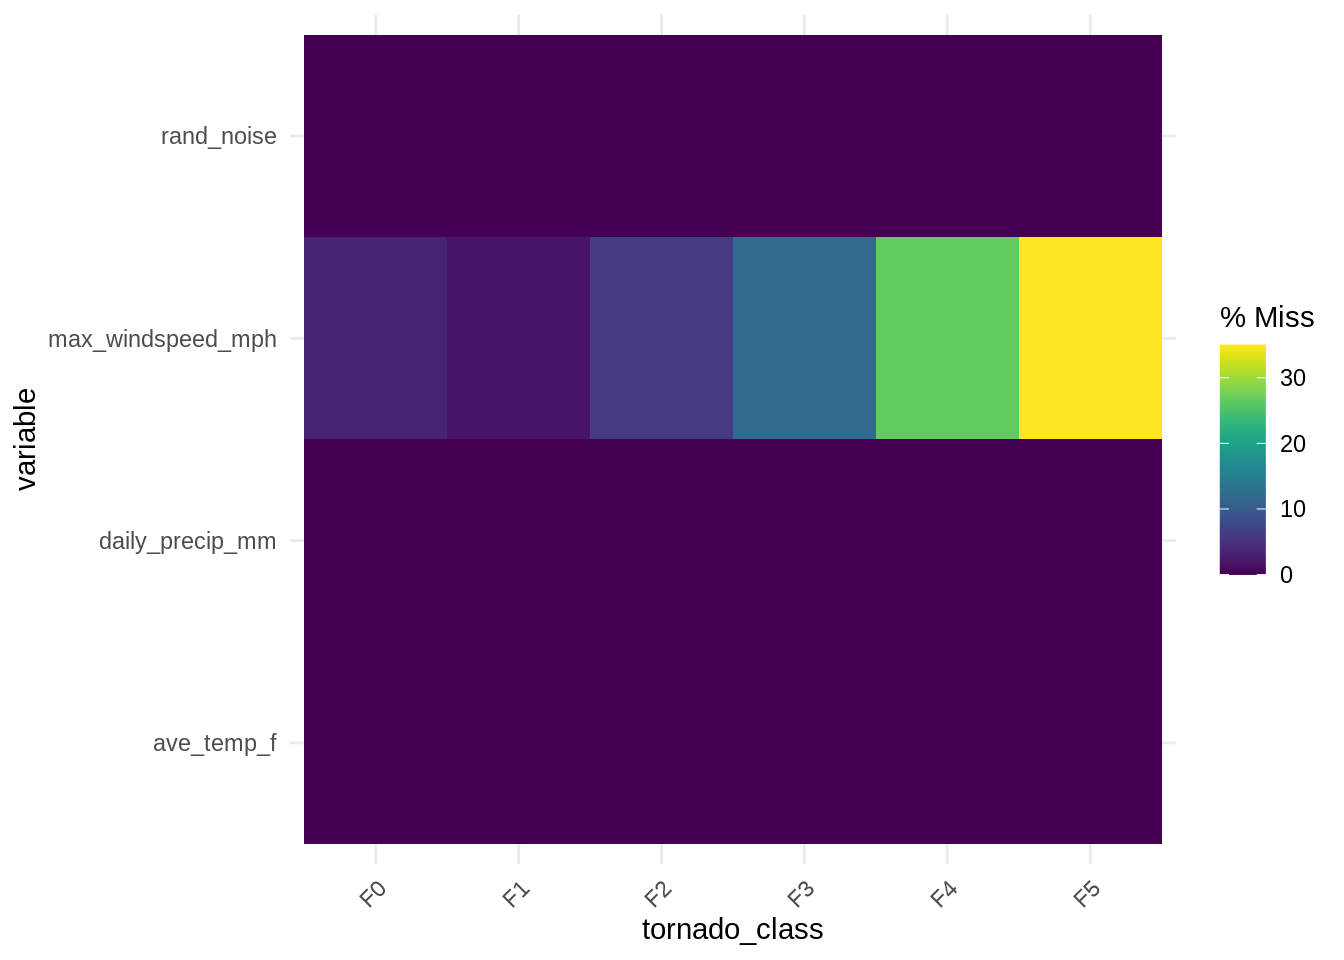
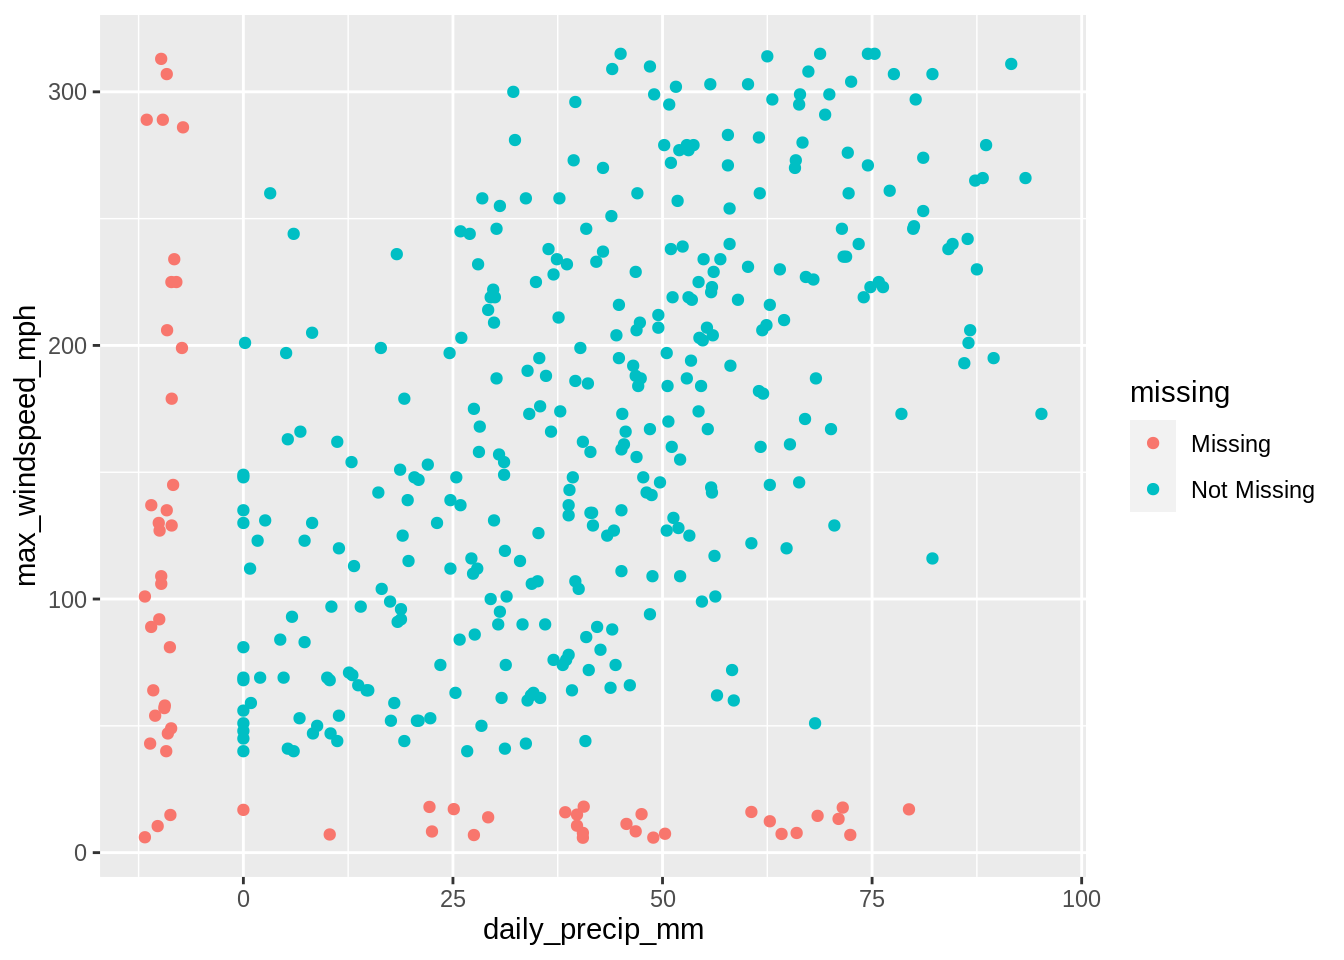
ggplot(data = df_mar) +
  geom_miss_point(aes(x = daily_precip_mm, y = max_windspeed_mph))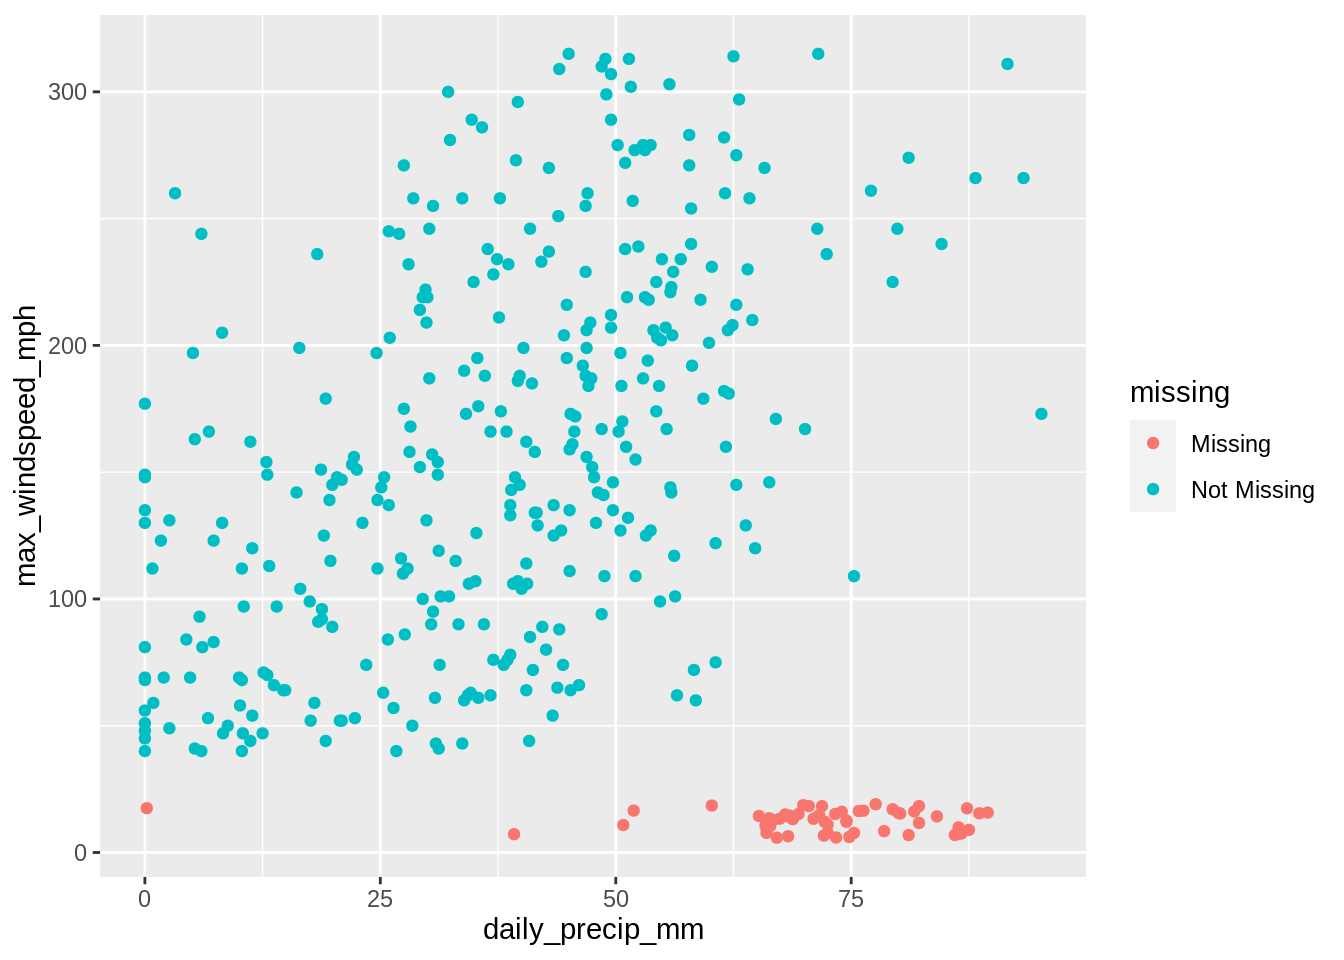
11.2.1 MAR: Implications
MAR data means you should be carefully imputing your data. Deleting observations with missing values is not appropriate, as you will likely bias your results.
[TODO: Add more details and worked examples of the implications in this section]
11.3 Missing not at random (MNAR)
11.3.1 MNAR explanation
If missingness within a variable is related to unobserved data (including values of the missing variable itself), the missingness is missing not at random (MNAR).
Let’s again envision that we are Bill Paxton, driving out to a tornado to release our devices that record wind speed. In this scenario, the tornado wind speeds are so high that upon approaching the tornado our truck is tipped over, thwarting our efforts to release the devices. Therefore, we are missing wind speed data for the tornado because the wind speeds were so high.
Because the missingness in wind speed depends on the unrecorded high values of wind speed, the values are missing not at random.
Critical thinking: Brainstorm other examples of how values could be MNAR, either from your own work or hypothetically.
df_mnar <- twister %>%
  mutate(
    # add some auxiliary random noise to add a sprinkle of missingness
    rand_noise = runif(n = dplyr::n()),
    max_windspeed_mph = case_when(
    max_windspeed_mph >= 200 ~ NA_real_,
    rand_noise > 0.99 ~ NA_real_,
    TRUE ~ max_windspeed_mph
))vis_miss(df_mnar)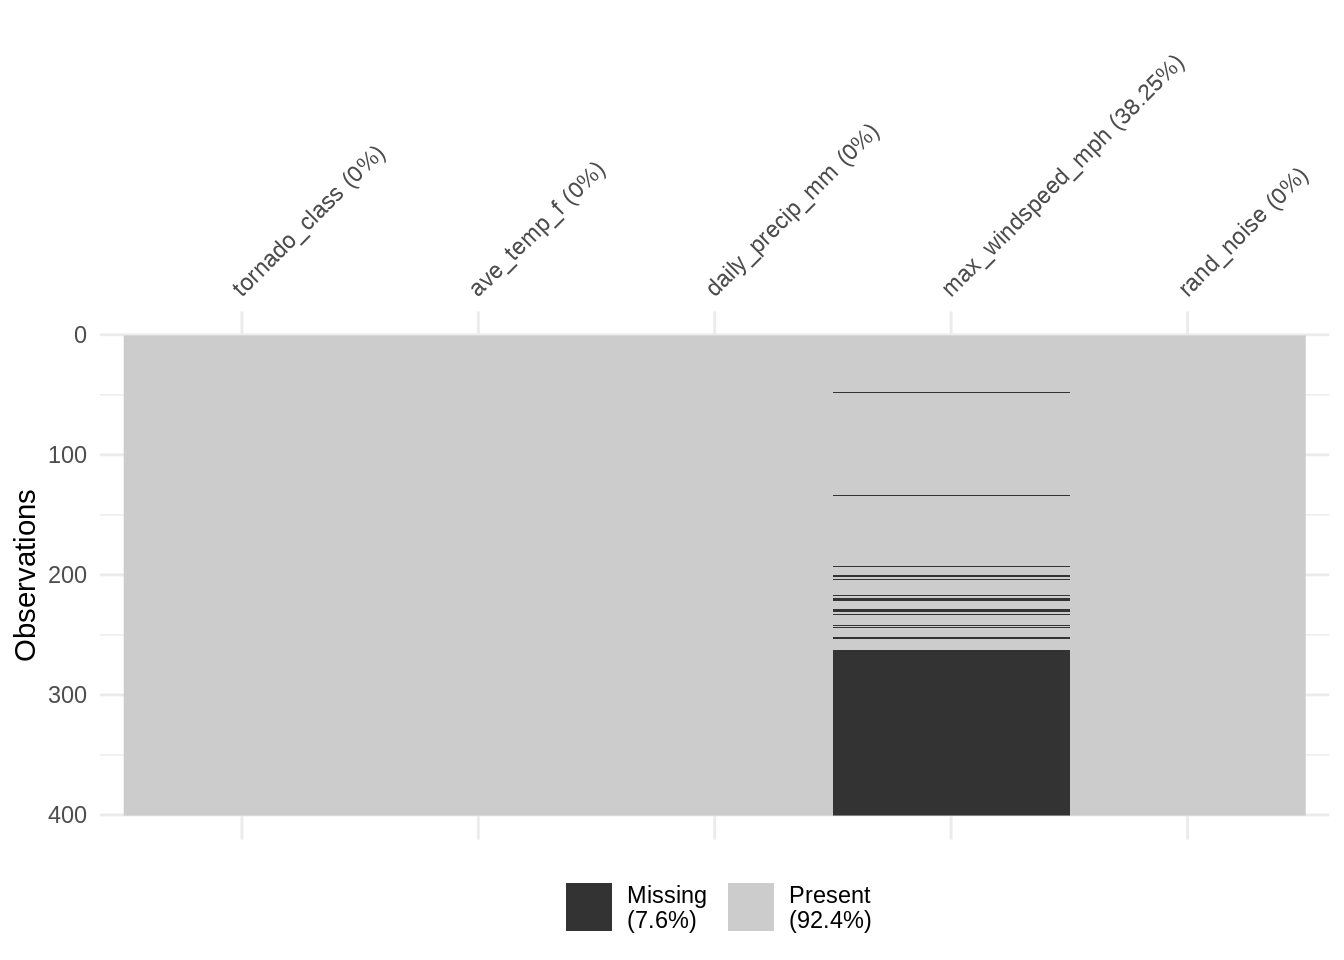
gg_miss_fct(df_mnar, fct = tornado_class)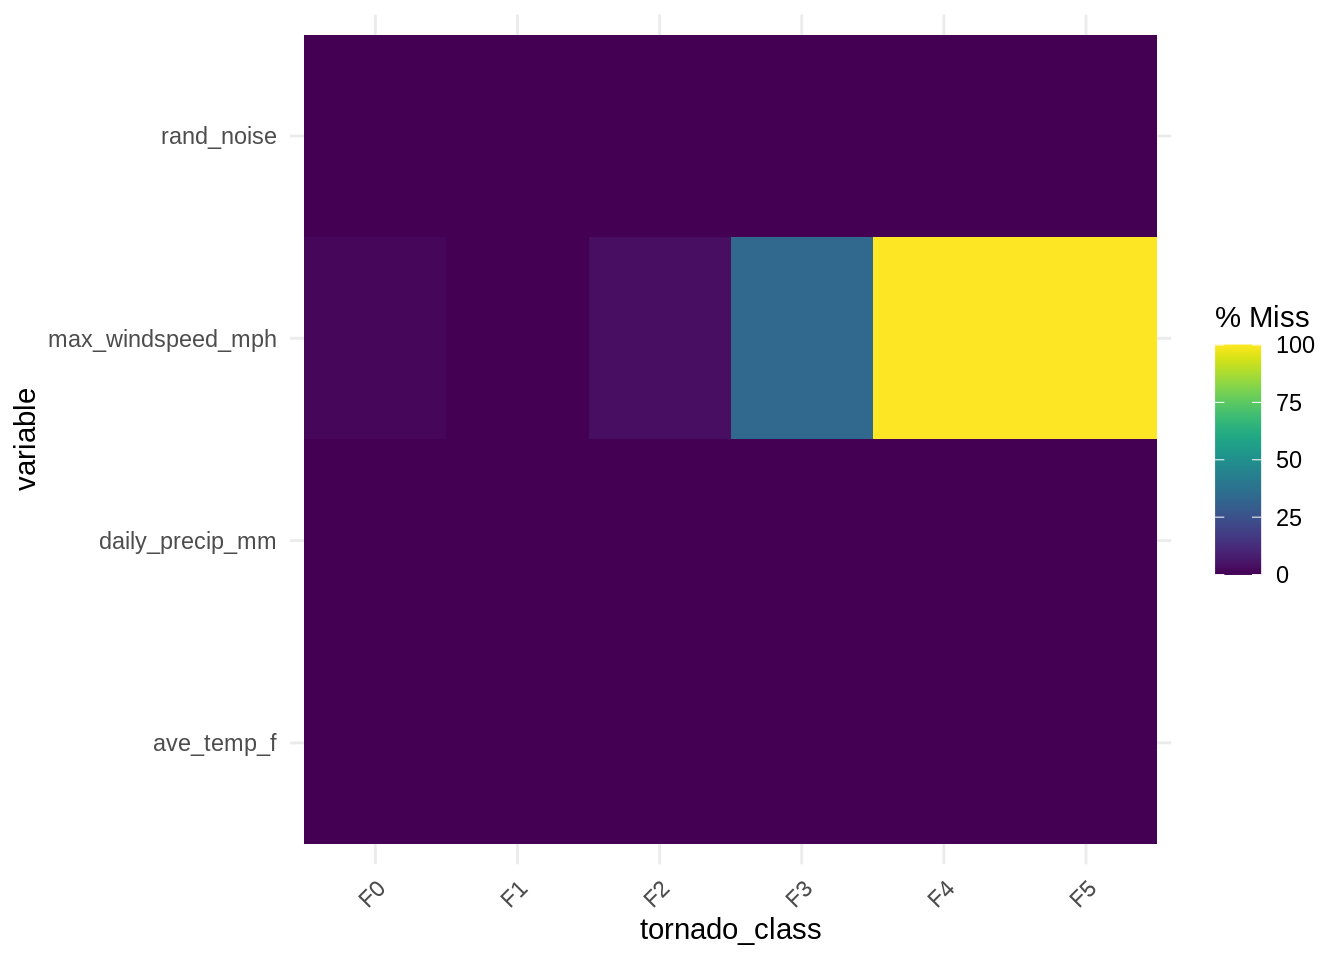
ggplot(data = df_mnar) +
  geom_miss_point(aes(x = daily_precip_mm, y = max_windspeed_mph))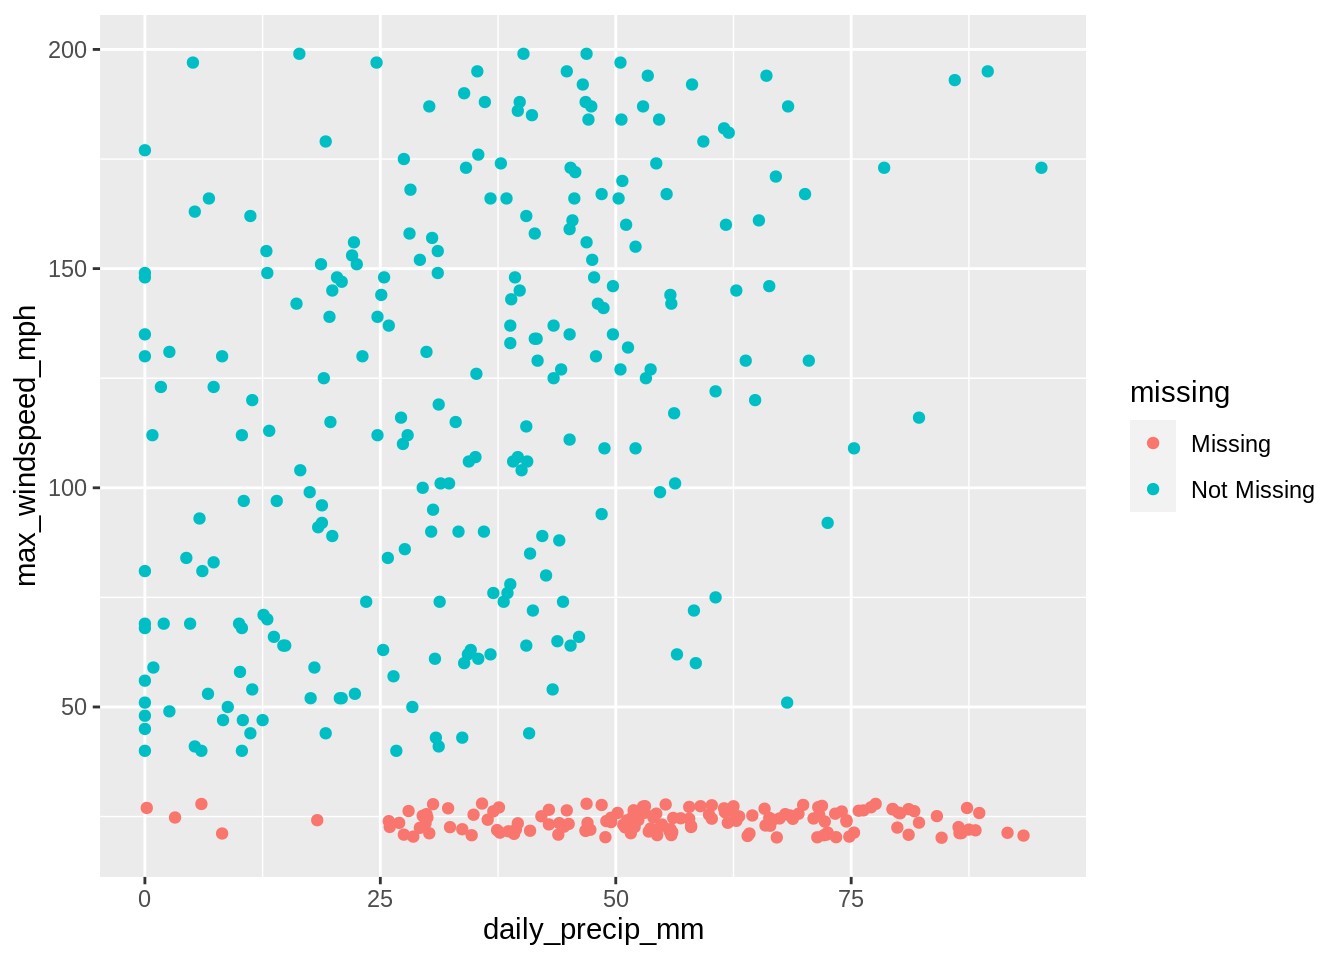
[TODO: unpack the difficulty in recognising this type of missingness]
It is hard to understand and identify this missingness precisely, as we can see in the example above, we’ve set values to be missing once windspeed is over 200Mph, we no longer have those values being recorded! Instead, it appears as though something happens to missing data once daily precipitation goes over 25mm.
11.3.1.1 MNAR: Implications
It is important to recognise MNAR as it introduces bias into the estimation of associations and parameters of interest.
11.4 Some more examples of MCAR, MAR, and MNAR
[TODO: combine these examples with the above examples for twister data]
11.4.1 Example: MCAR
Now we are going to cover some visualisations to show what certain missingness structures might look like.
vis_miss(df_mcar, cluster = TRUE)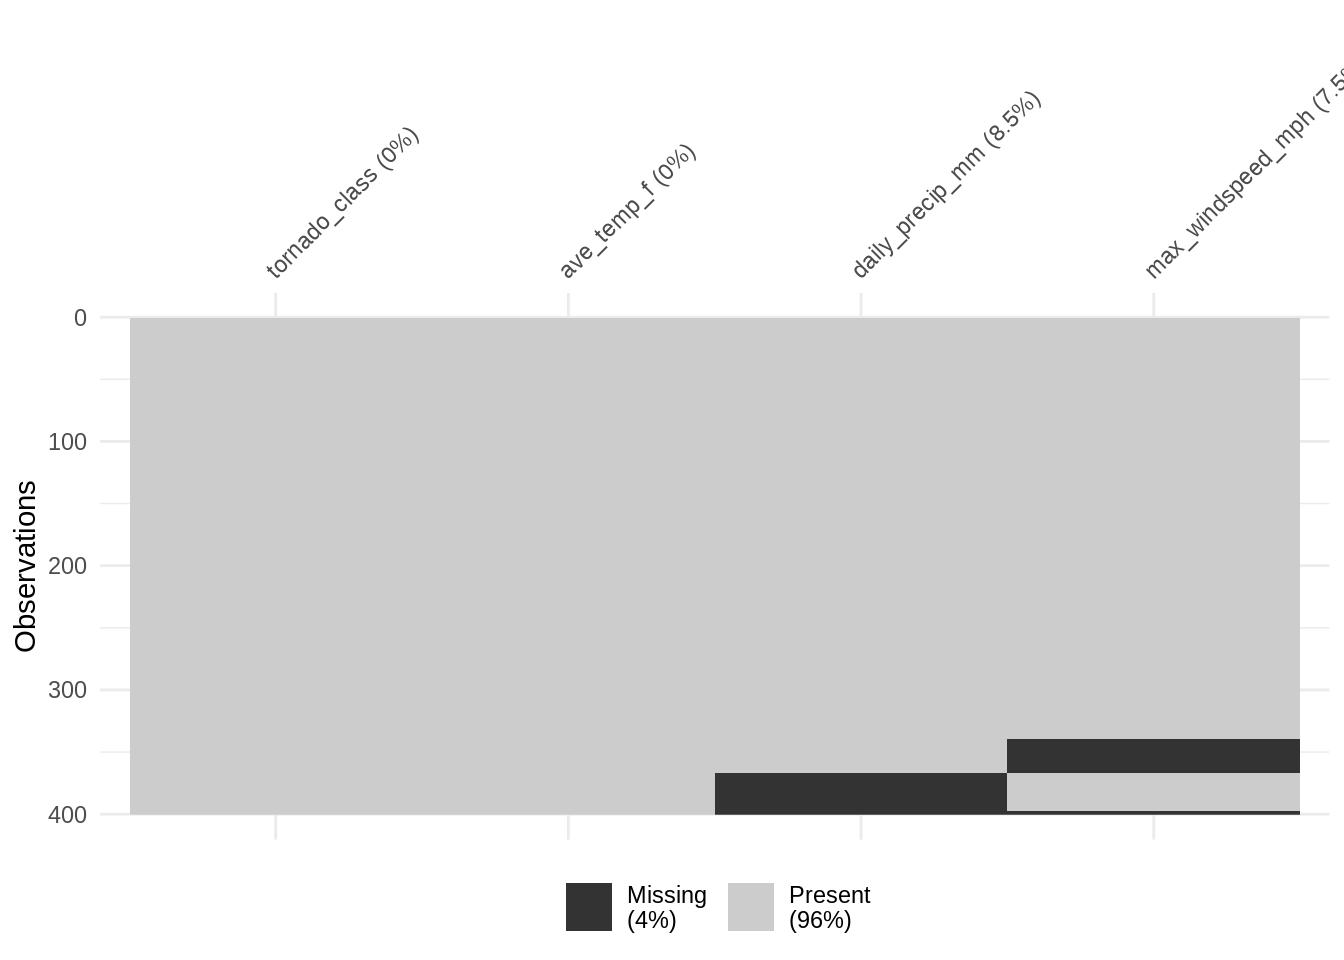
Looking at our data mt_cars, we have applied some clustering to the missingness - and we see that there is still a lot of noise in the missingness. We can also try arranging by a few different variables, but the important thing to take away here is that “random” or “noisy” looking pattern generally suggests there isn’t much variation going on in our data. We could say that it is MCAR.
11.4.2 Example: MAR
We can do something similar for another dataset, oceanbuoys.
oceanbuoys %>%
  arrange(year) %>%
  vis_miss()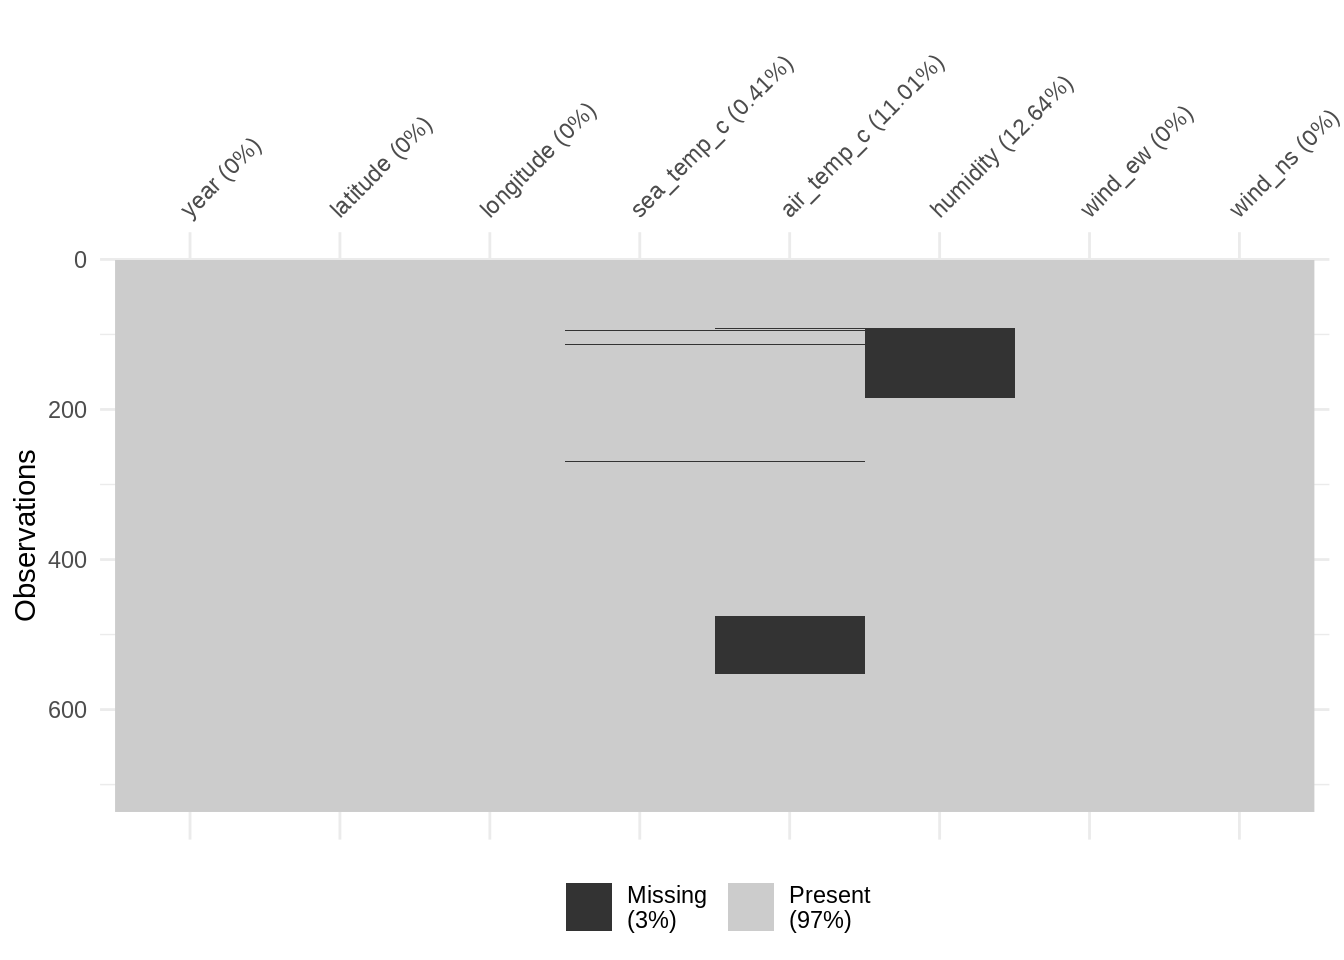
Arranging by variable year we see that there is some definite clustering of missingness - this is a common symptom of data MAR.
11.4.3 Example: MNAR
ocean <- oceanbuoys %>%
  mutate(wind_ew = if_else(sea_temp_c < 26.55,
                           true = NA_real_,
                           false = wind_ew),
         wind_ns = if_else(sea_temp_c > 26.55,
                           true = NA_real_,
                           false = wind_ns)) %>%
  select(-sea_temp_c)
Finally, here is some data MNAR.
vis_miss(ocean, cluster = TRUE)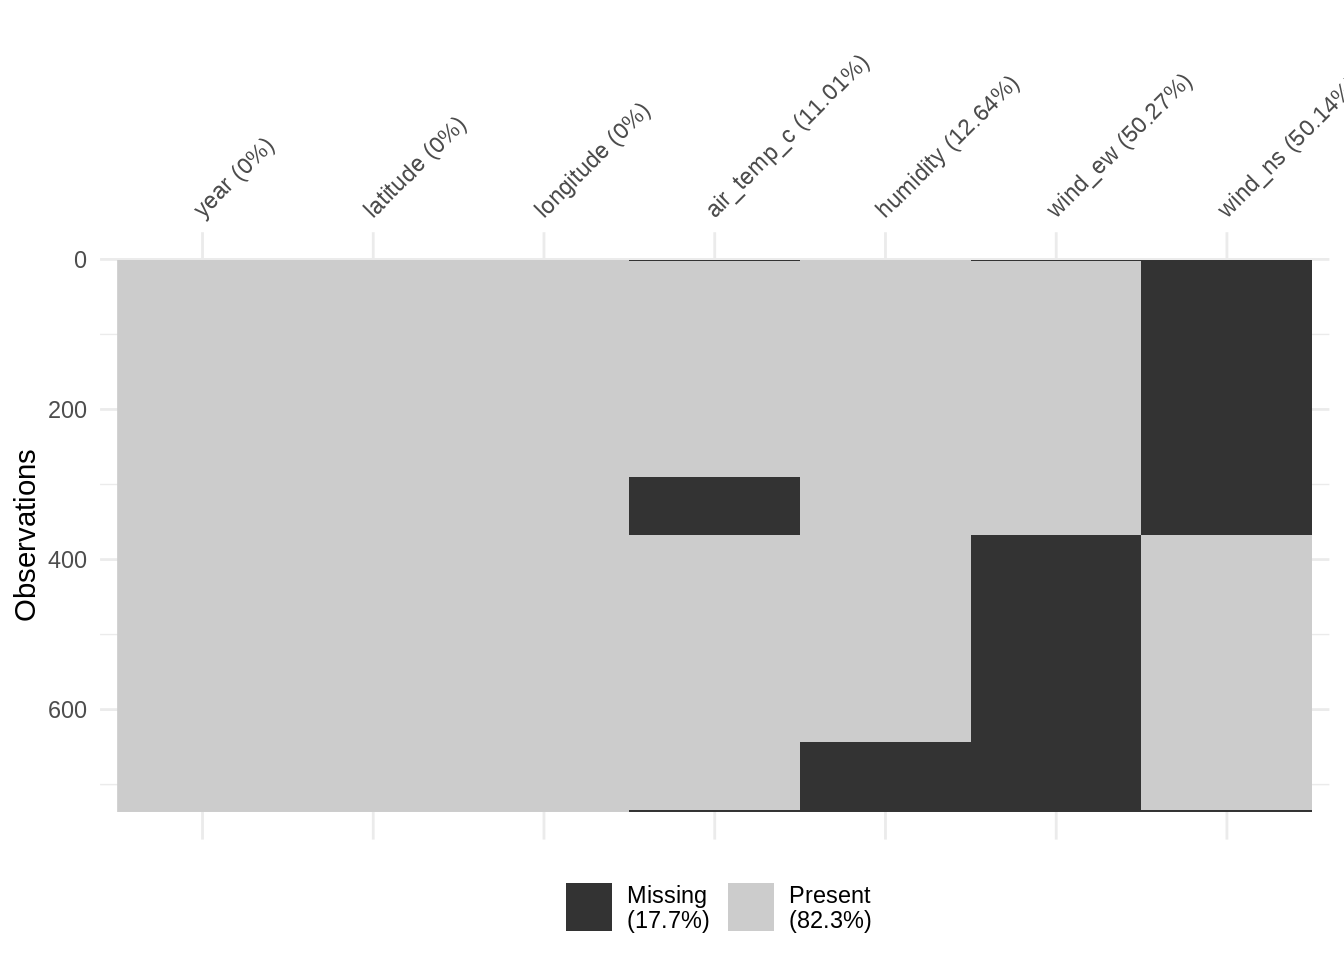
Here, we have our ocean data, but I have made wind variables be missing according to a variable I have removed from the dataset - something now unobserved. In this case, we can see some very clear structure, but this is not always the case.
It is important to remember it can be very difficult to ascertain whether missingness MCAR, MAR or MNAR. These visualisations are one way to explore missingness, but they are not definitive - we will cover some more useful methods later on in the course.